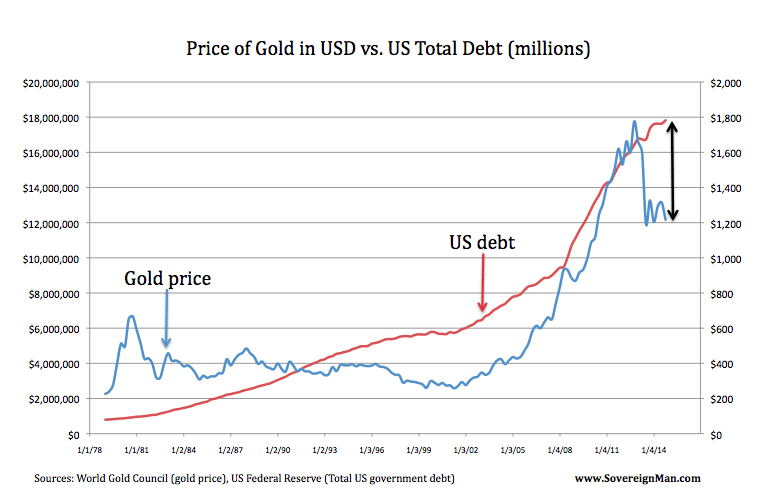
Three years ago, with national debt levels rising, gold inexplicably went into free fall. Some three years later gold is still dragging the bottom of its range near 1200. It has been a three year bear market. With national debt levels at 17.9 trillion, I don't even think there's a little old lady in Kansas that believes we can pay this debt off.
The only two ways this debt ever gets paid off? Default or a hyperinflationary event.
For gapers only.

4 comments:
One angle that might be useful somehow is that shale oil reserves in the US are about double the amount of worldwide oil reserves as of a few years ago.
Maybe all our entitled class of do-nothings will become the next generation of Kuwaitis.
https://www.cia.gov/library/publications/the-world-factbook/rankorder/rankorderguide.html
Note that oil reserves only show the current easy to process amounts. The North American shale oil isn't currently considered part of that calculation.
There is much to consider about oil from shale still.
http://dailyreckoning.com/oil-shale-reserves/
Maybe it is as simple as Saudi Sheiks get cheap gold or the world gets expensive oil.
Simple overbought retracement. Overall looks to be a 38.5% Fib set to continue up or head to 50%($1000). ">
Post a Comment